
A leafy learning lab
The Old Forest State Natural Area is full of mysteries. Why do some large trees withstand a windstorm while others fall? How old are our oldest trees? What plants are regenerating when a big tree falls and creates a gap that lets sunshine onto the forest floor? What replaces the invasive plants like kudzu and privet when we remove them?
Understanding answers to questions like these is important to Overton Park Conservancy’s management of the forest. Knowing, for example, that small oak saplings are filling in those canopy gaps lets us know that we don’t need to intervene and consider planting seeds in that area. If the saplings are those of an invasive plant like tree of heaven, however, we begin to consider actions to reverse that trend.
But answering all these questions means collecting a great deal of baseline data so that we’ll be able to measure the forest’s health over the long term. And that’s a big job. Luckily Memphis has excellent academic institutions whose professors and students understand the Old Forest’s potential as a learning lab. We’re working with these academic partners to collect a tremendous amount of data that helps us understand the forest’s health and guide our management decisions. Here’s a small sample of what we’re studying.
How Trees Regulate Temperature
At the Conservancy, we constantly hear from runners who tell us they like to do their summer runs in the Old Forest because “it’s fifteen degrees cooler in there.” Dr. Susan Roakes’ Urbanization/Environment class at the University of Memphis recently ran a test based on this principle: that in cities, built areas are often appreciably hotter than areas with substantial tree cover. Through the shade they provide and removal of heat from the air through evapotranspiration, trees can reduce a city’s average temperature by 2 – 9 degrees Fahrenheit.
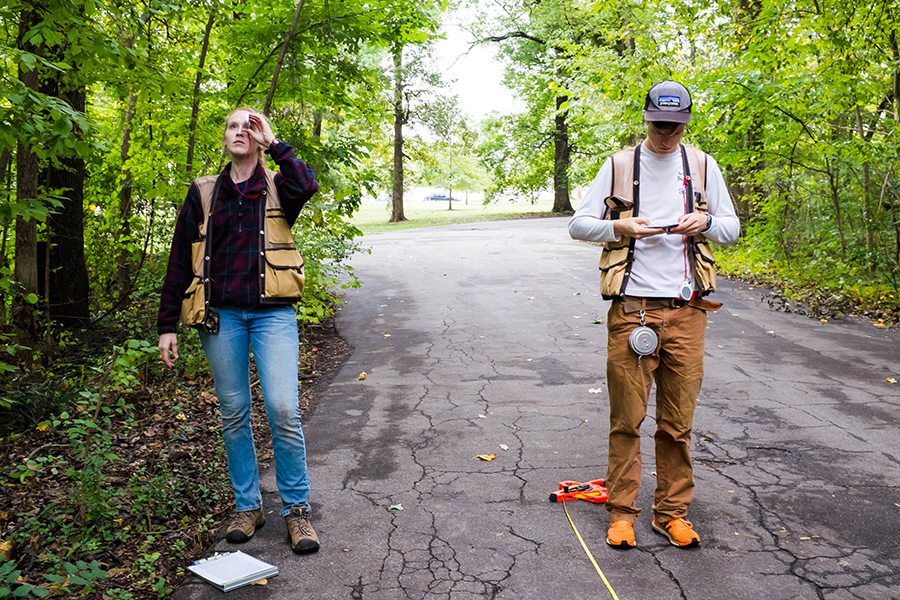
The students conducted their experiment by sending two teams out simultaneously, one to a shaded area in the Old Forest and one to a paved area on Sam Cooper Blvd. Each student was equipped with a sling psychrometer, a double thermometer that measures both air temperature and humidity. Using the dry thermometer, the students took the air temperature. They then dipped the wick of the second thermometer in water and twirled it around for several minutes to evaporate the wick and cool the thermometer. Dry air cools the thermometer more and lowers the wet-bulb temperature. The two temperatures are then compared using meteorological charts to determine the relative humidity.
Since trees release water vapor through evapotranspiration, the idea is that on a hot day, the air in the forest should be both cooler and more humid than an open, paved area would be. On a cool day like the day the students visited, it wasn’t hot enough to get a true heat island effect, but we’re looking forward to hearing what they learned after they’ve made their calculations! We hope they’ll return soon to learn more about the differences between the forest interior and the world outside.
Taking a Forest Inventory
We already know there are over 300 species of flowering plants in the Old Forest. What we don’t always know is where all those species are, how they’re relating to each other, and whether those relationships are different now than they were 10, 20, or 50 years ago. But with the help of the Rhodes College Midtown Urban Forestry Fellowship program supervised by Dr. Kimberly Kasper, we’re beginning to collect data that will help answer some of those questions.
Over the next two semesters, two fellows from Rhodes will be in the Old Forest several times per week collecting data from pre-determined “plots.” Some of the information they’re gathering includes:
- GPS locations, height, diameter, notable individual specimens, and growth rates of the large old “remnant” trees
- Locations of large canopy gaps left when large trees fall, and the regeneration rates of new trees there
- Species, locations, and extent of harmful invasive plants
- Levels of stocking — how many of each kind of tree do we have?
- Evidence of insects and disease in the plant population
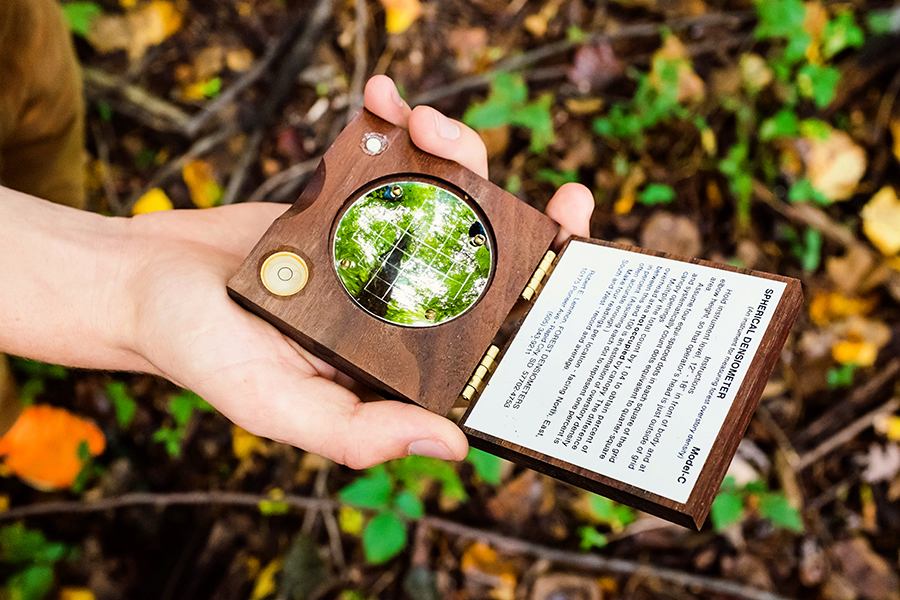
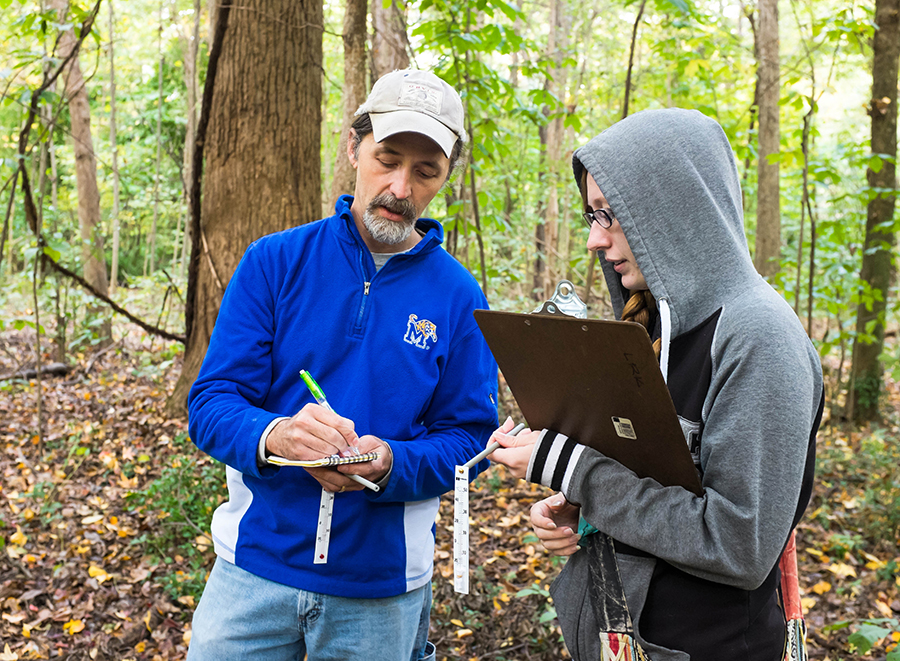
On a typical plot, the fellows will record all the species they see, check the diameter of larger trees, record whether there are any dead trees, and estimate the height of tall trees using special measuring equipment and the trusty old Pythagorean theorem. They have spherical densiometers to measure how dense the canopy overhead is, and a tree swatter filled with chalk to temporarily mark which trees they’ve already studied that day. All this special forestry equipment was generously donated by the folks at Park Friends for this project.
When their project is complete, we’ll have a much better idea of how our forest is composed. There’s no telling what exciting things we’ll learn along the way, but we can’t wait to share them with you!

